A multi-functional data processing tool used for ‘scoring’ post-lab testing assets.
In crop science, scoring involves assigning numerical ratings to various factors such as crop health, soil quality, and other key indicators to evaluate their status and productivity potential. These scores help assess the effectiveness of management practices, pinpoint areas for improvement, and support informed decision-making to maximize crop yields and optimize the use of resources.
The Problem: Over time, many labs across Bayer developed their own unique system for scoring. These systems ranged from Excel files and email to proprietary online applications built on old systems that did not communicate.
The solution: Create one tool that would be adaptable enough to account for many different lab workflows, centralize the data sets, speed up the process, and create a better, more consistent user experience across all labs.
- Ramping up on product knowledge: All of the team was new to Bayer, unfamiliar with lab processes and lingo, and very unclear on what Scoring was
Solution: Find a small, core group of users who were knowledgeable, willing to be available for barrages of questions, and were willing to be patient. Also, we needed to show them that we were willing to learn, respectful of their time, and tracking the knowledge they were conveying to us. - Many workflows, one tool
Solution: I worked closely with the developers to create a modular application so variations in workflows could be adapted to quickly with little disruption.
- 87% of labs have migrated to the new tool
- 320% decrease in time from request to results
- 47% decrease in retests due to human error
Users: Analytics Lab Managers, Analytic Lab Technicians
- User Interviews – Individual and Group
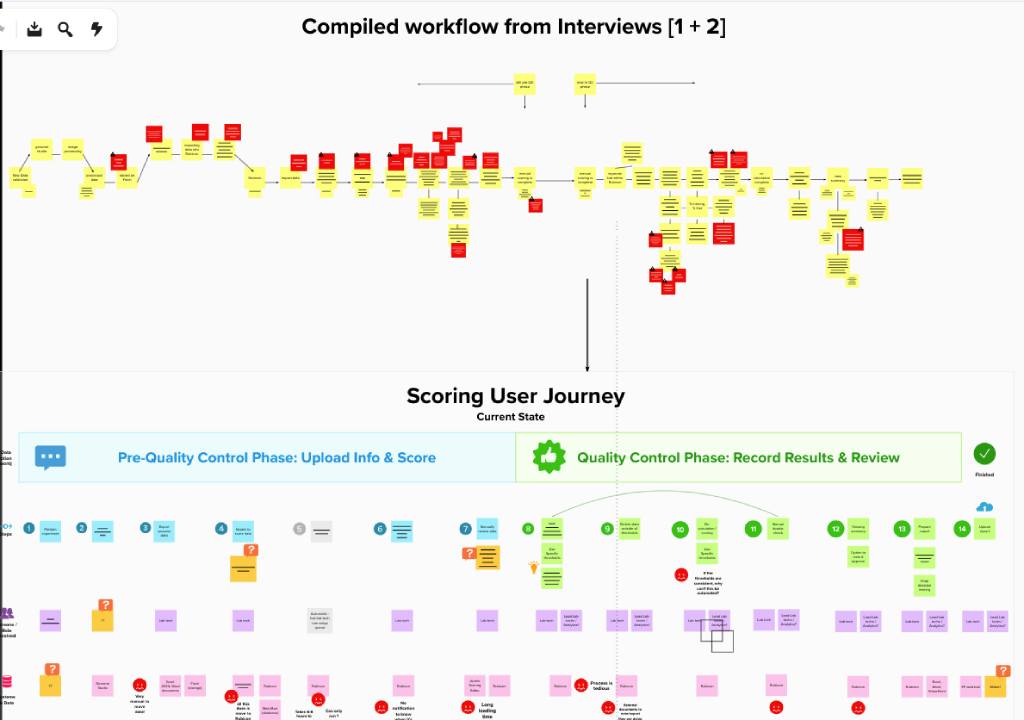
- Journey Mapping
- Wireframes, Comps, Prototypes
- Iterative design: discovery, design/build, and review
- Sr. Product Designer (Me)
- 1 UX Researcher
- 1 Project Lead
- 1 Front-end Developer
- 3 Back-end Developers
Online Whiteboard (Mural) for Project
The entire team would attend all user interviews. The UX researcher and I would take notes during the interviews, review the Mural board afterward, then reach out to our user groups with any questions. The Mural board would be reviewed with the team before any design began. This board contained all notes, video, personas, journey maps, etc. and was accessible any time to anyone on the team.
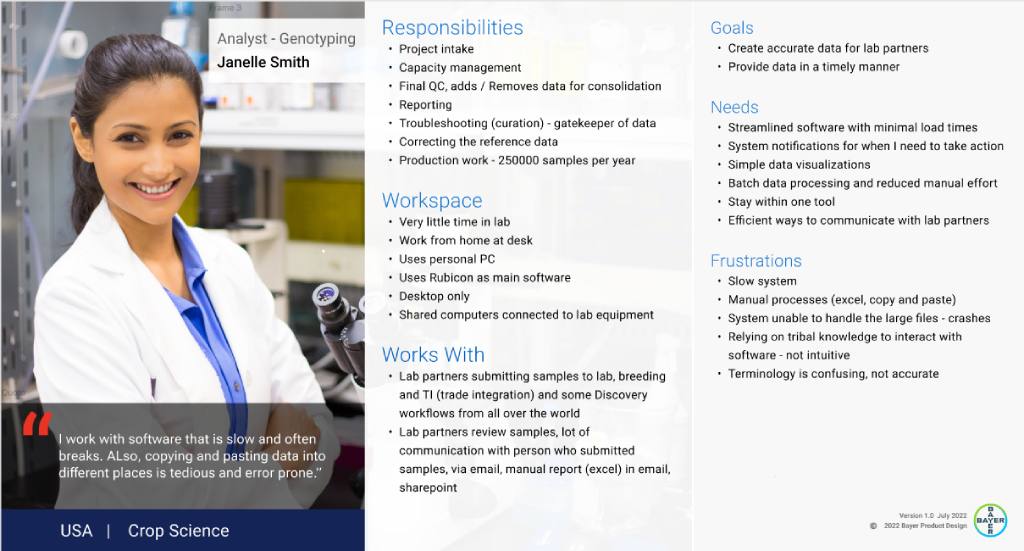
User Persona
The personas were gleaned from the user interviews and reviewed and refined with the user groups.
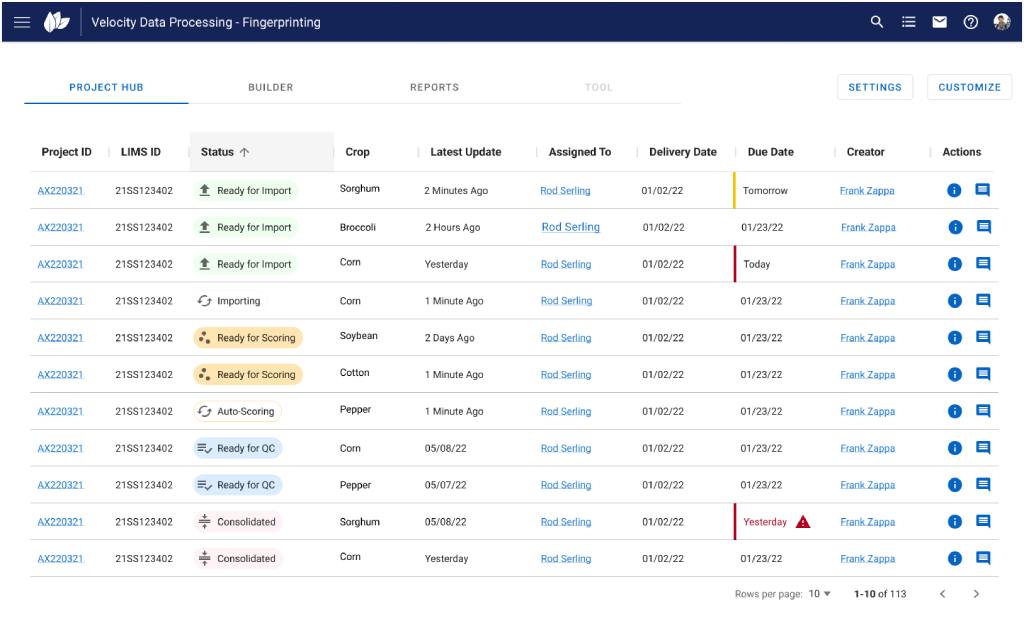
Mock-up for the App Dashboard
The dashboard would essentially look the same for every user in any lab across the globe, bringing the data to a centralized location and consistency for all users.
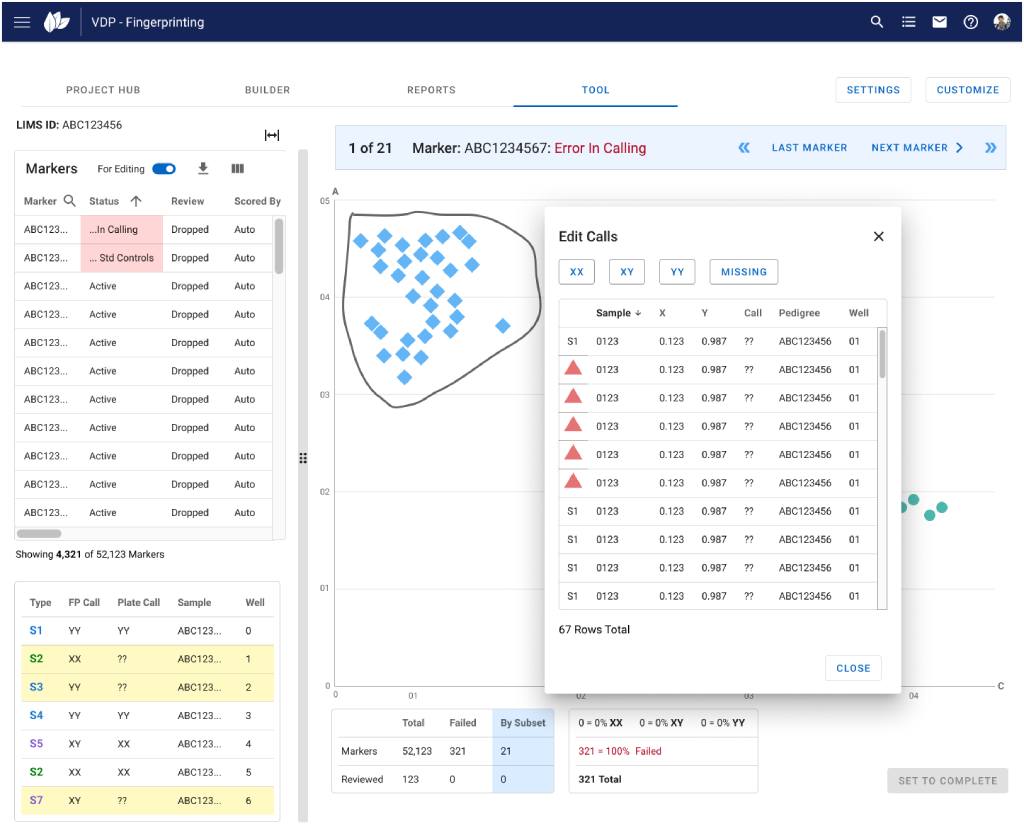
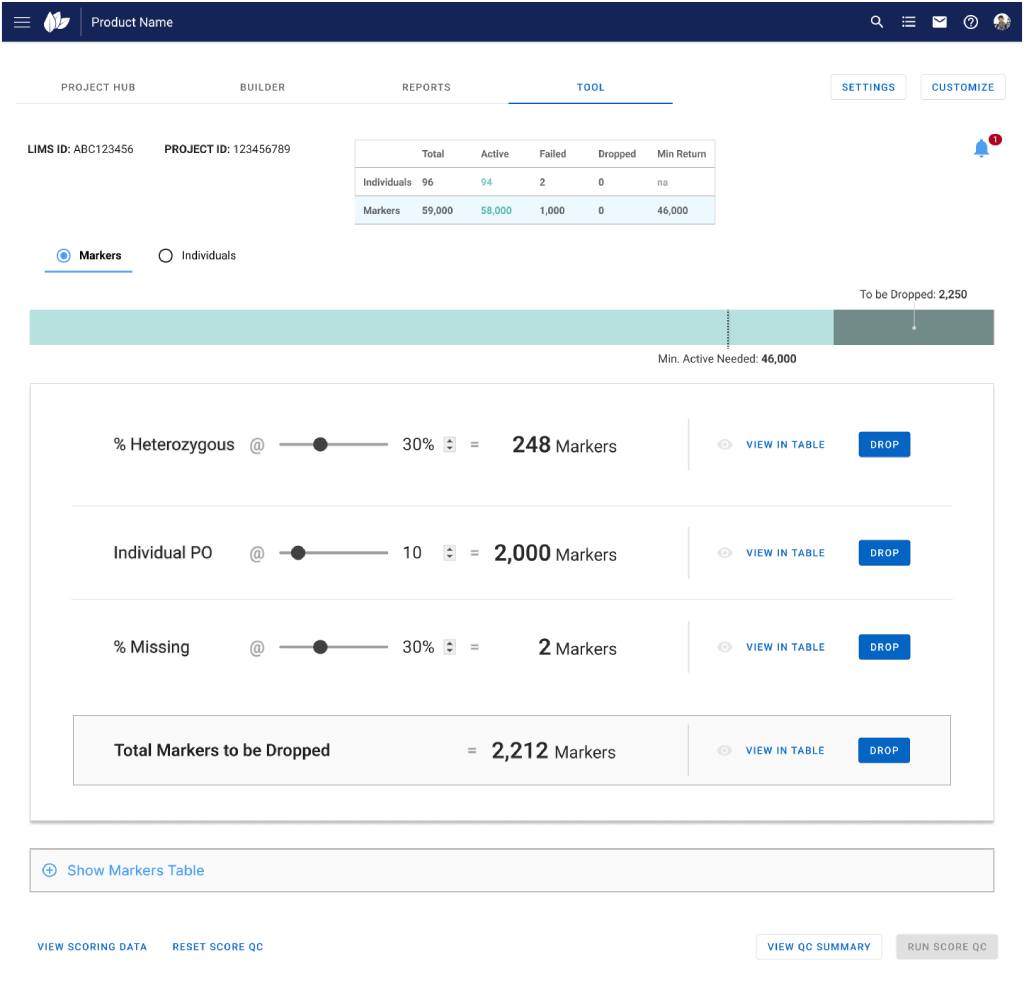
Mock-up for the Manual QC Tool – 1
Once the user entered a project from the dashboard, a more customized workflow would be triggered depending on the lab. We utilized a modular approach so the design would be more adaptable to the different workflows.
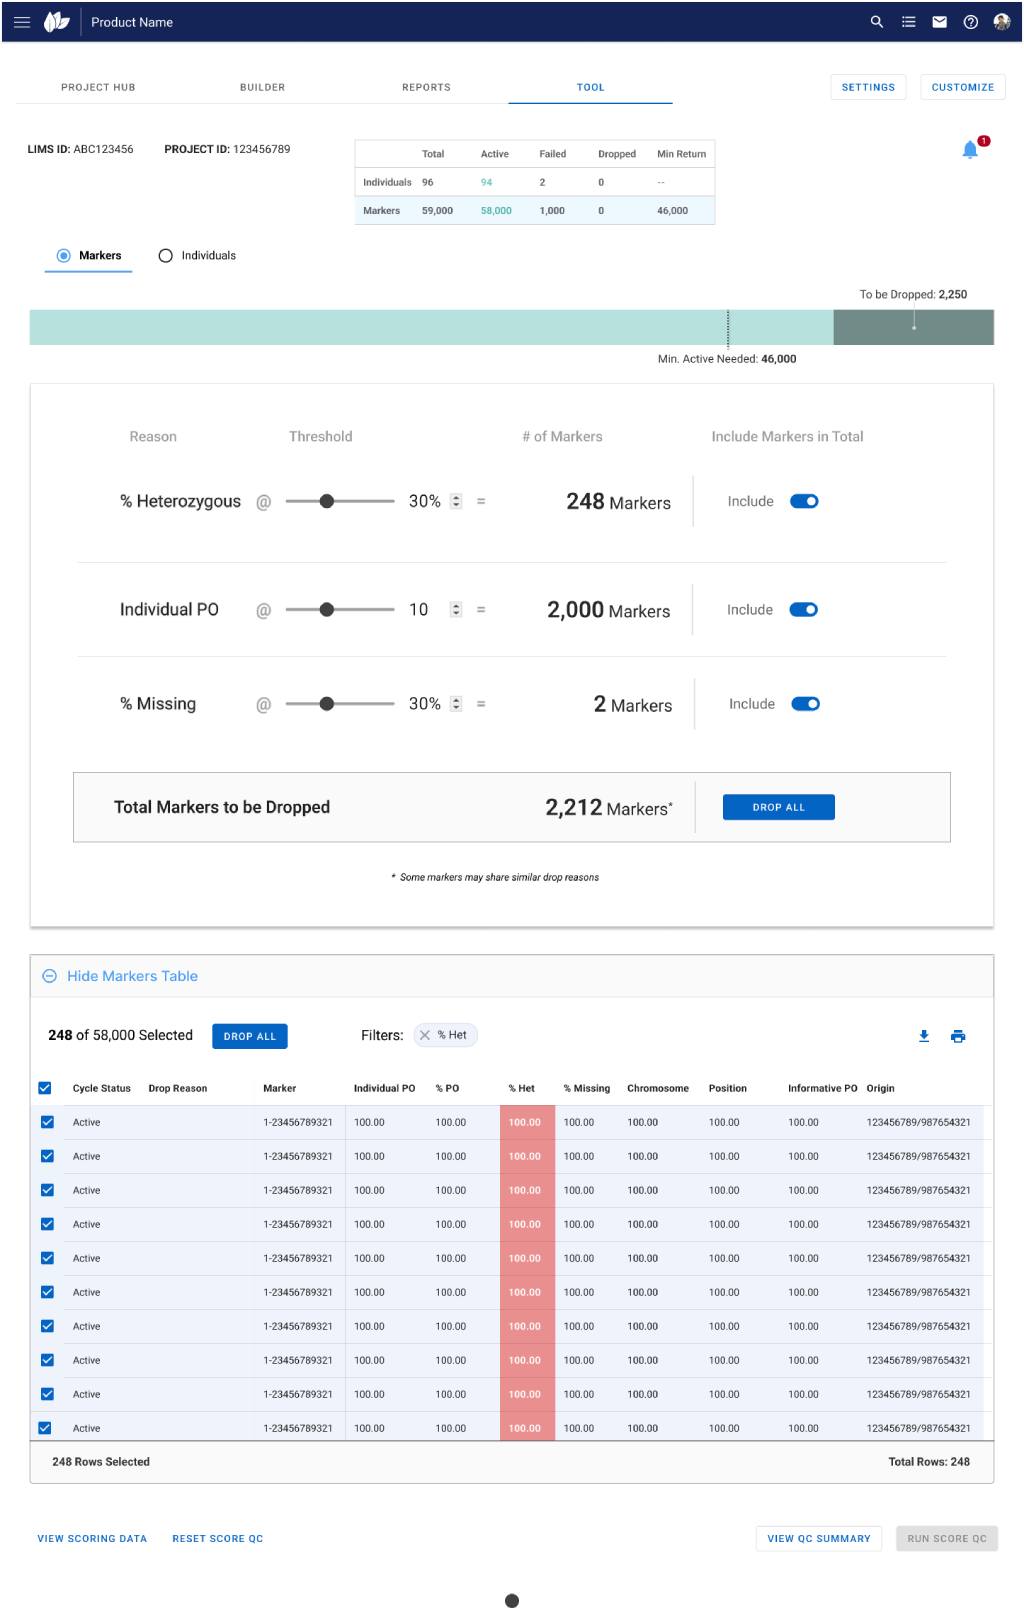
Mock-up for the Manual QC Tool -2
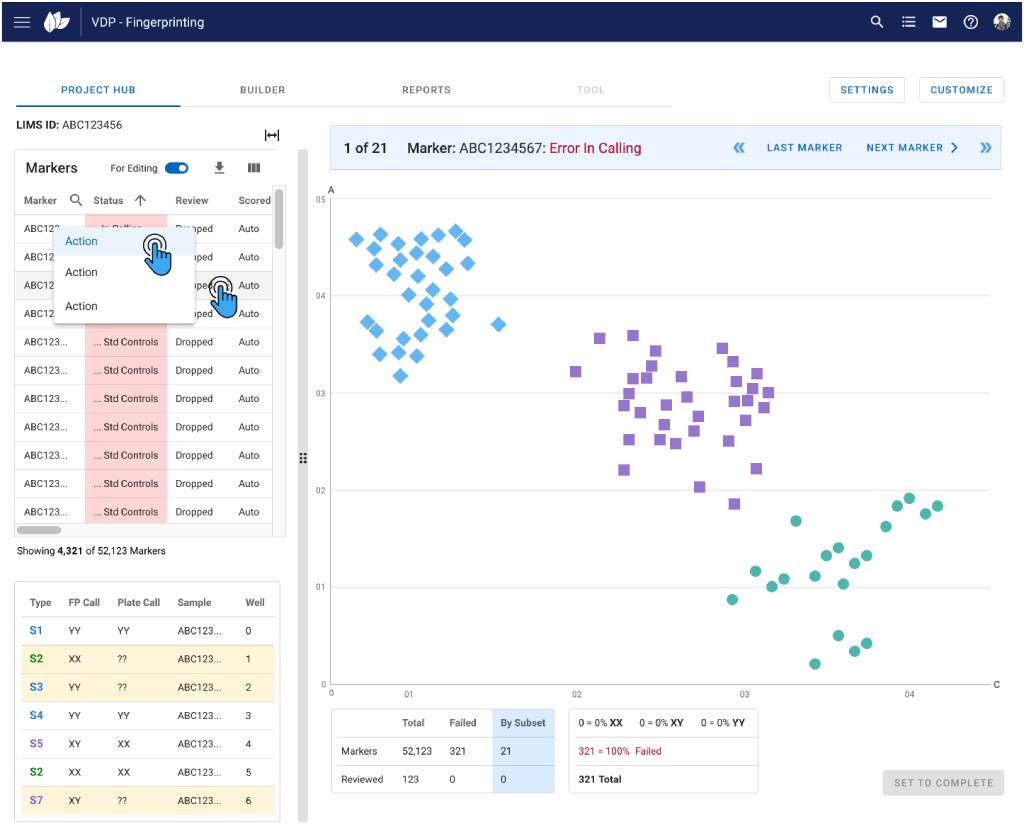
Mock-up for the Manual Scoring Tool – 1
Mock-up for the Manual Scoring Tool – 2